Profile your code
On this page
A request's timeline says which query or call was slow. When the time went to your own code, a profile says which functions: the Monitor samples what's running every few milliseconds while a request runs, and draws what it found as a flame graph.
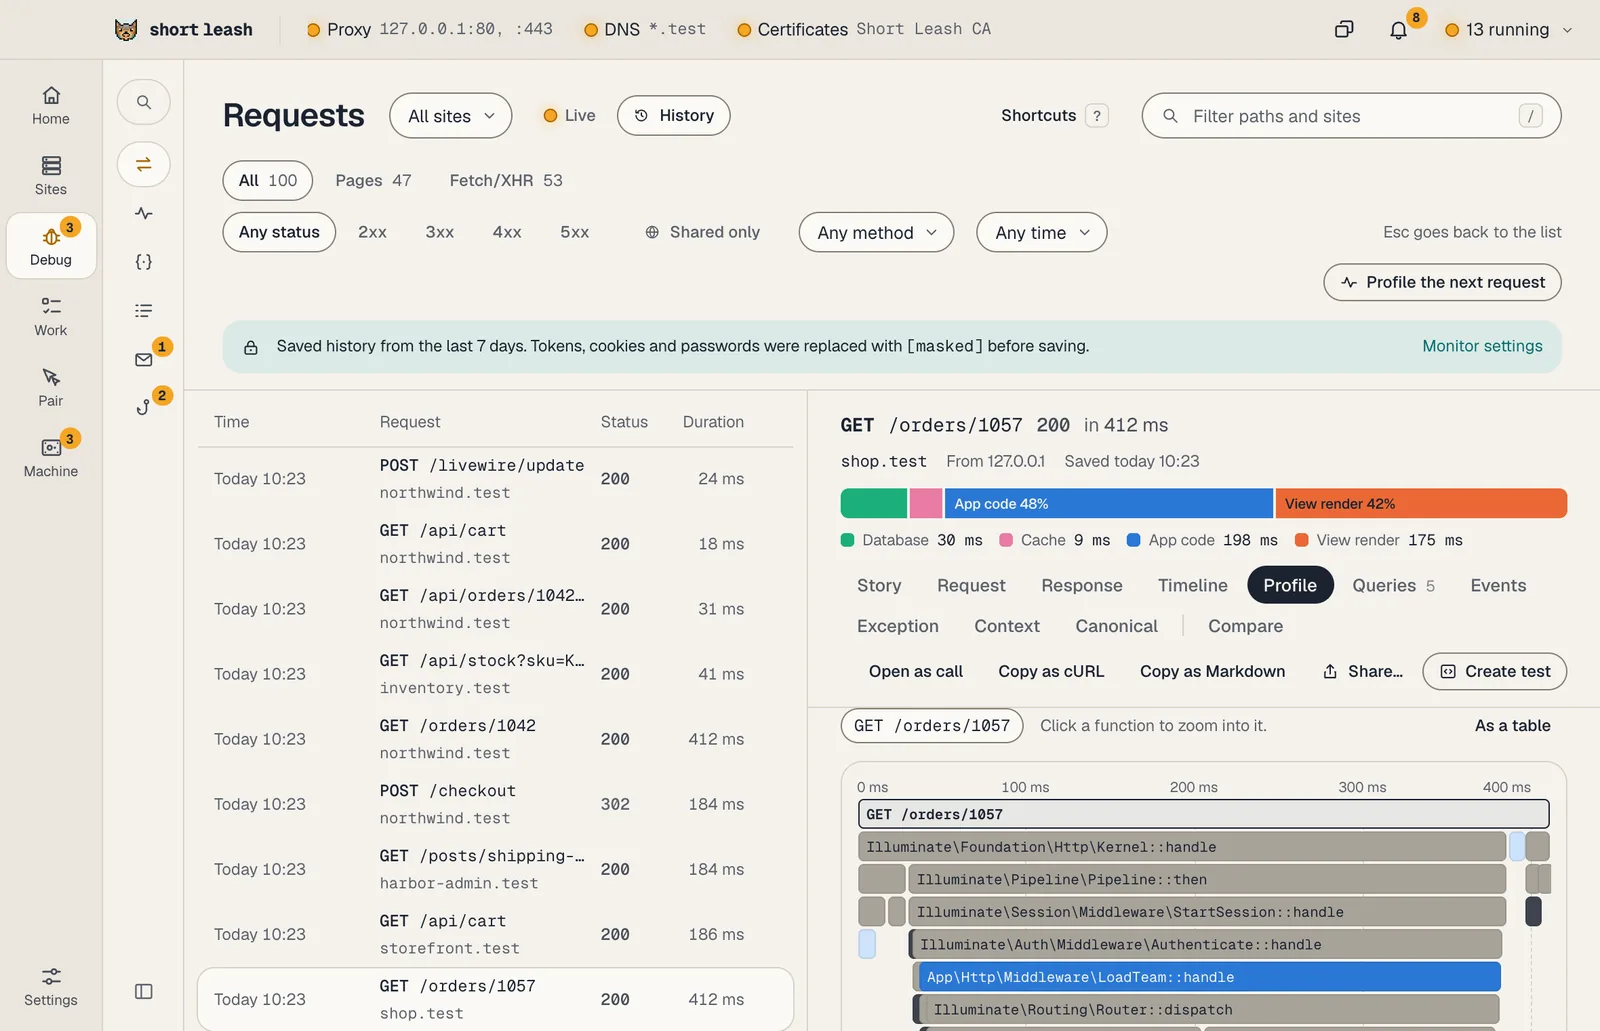
Profiling is off until you ask for it, and it's part of Short Leash Pro.
How do I profile a request?
- Profile the next request: in Requests or in Site settings › Monitor, choose it, then load the page or send the request. Short Leash profiles that one request from this computer and stops. It slows that request by about 10%.
- Turn on the site's profiler: in Site settings › Monitor, turn on Profile shop.test's requests (with your site's name). Short Leash then profiles every request to the site from this computer and keeps the useful ones (see below). Take a sample every sets how often it looks: 1, 2, 5, 10 or 20 ms, 2 ms until you choose. Shorter catches quicker functions and slows a profiled request more; the setting says what a profiled request costs. Requests that aren't profiled take no longer.
The site's own long-running processes that Short Leash starts, such as a queue worker, are profiled from their start while the profiler is on, each job or command on its own. Turning the profiler on or off reaches them when they restart.
Only traffic from this computer is profiled, never requests that come through a share. Short Leash's proxy asks for a profile with an x-leash-profile header it adds to the request, and removes one a visitor sends.
What does a profile show?
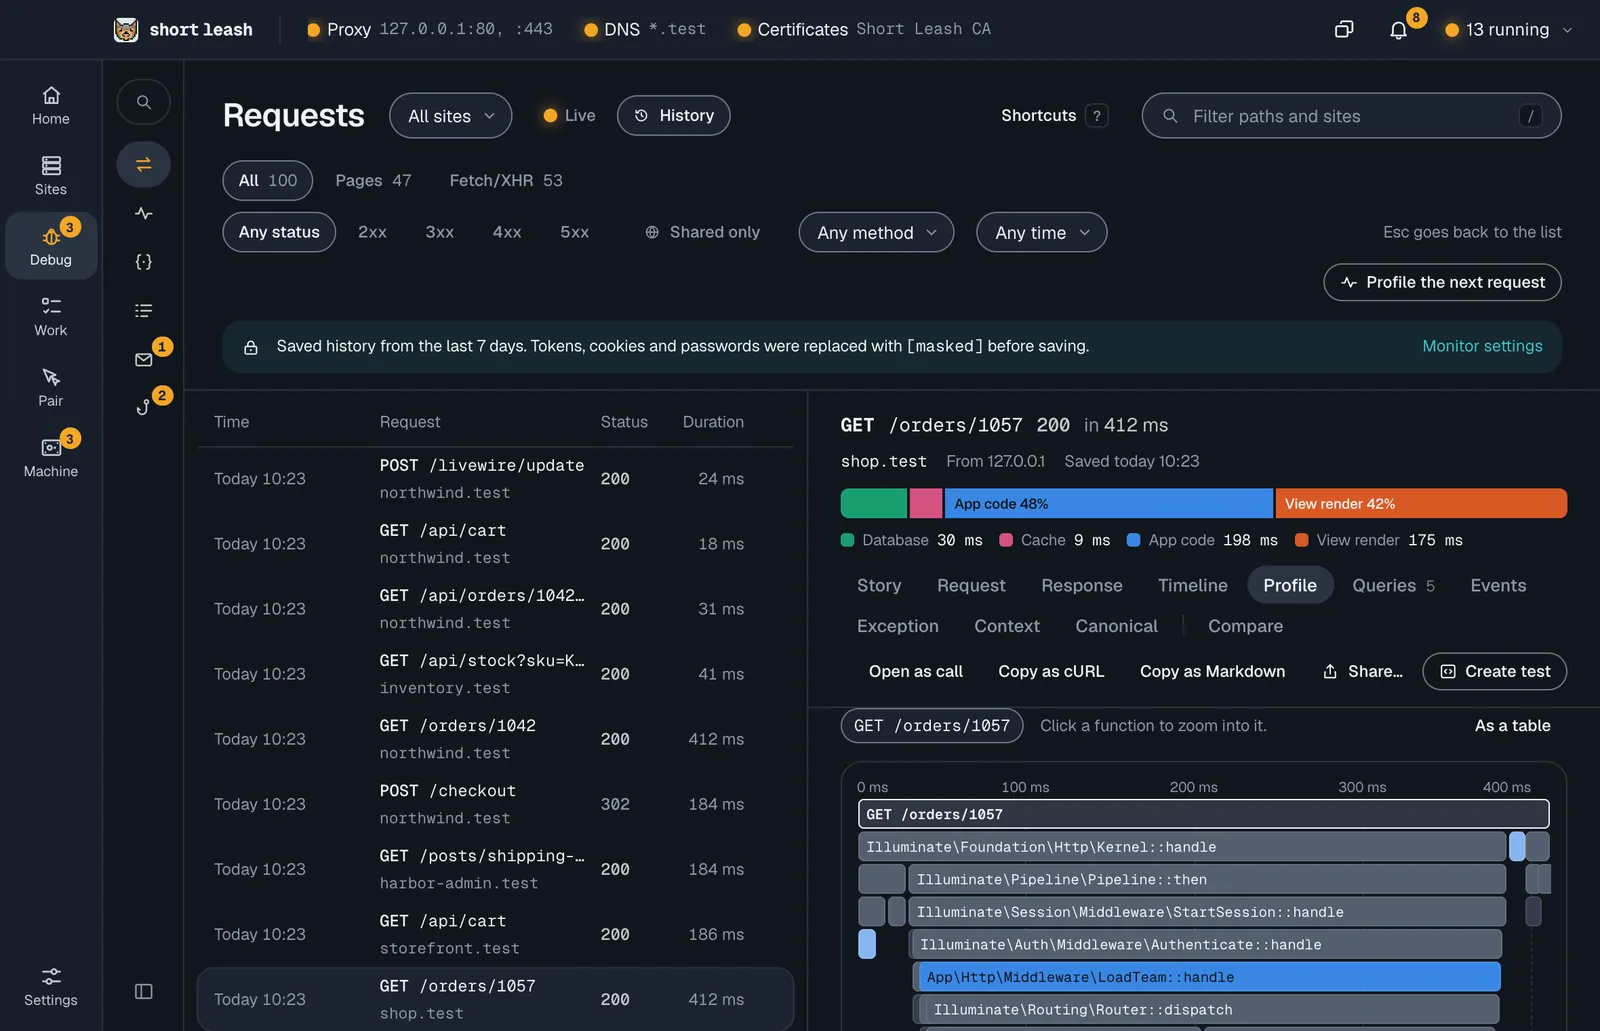
A request's Profile tab draws the functions it ran as a flame graph, each coloured by where its code is: your app, the framework, a library, the runtime or native code. Click a function to zoom to it, and its card says how long it ran on its own and with what it called, from which file and line. Search marks a function wherever it ran. Pick a span from the chips to see only the functions that ran inside it, and the span panel beside the Timeline shows the functions inside a span too.
- Flame: the whole profile, merged, so the widest frames took the most time.
- Sandwich: one function between its callers above and what it called below.
- Top functions: every function as a table with its own time, its total, its samples and its share, sorted by any column and searched by name.
A request that wasn't profiled says why, and how to get one.
Can I see a whole route?
Yes. A route's panel in the Monitor has a Profile that merges its profiles over the range you picked, up to its 200 newest. Compare it against the commit before, or against the period before, and each function is marked faster or slower: under 2 ms or 5% counts as no change.
For AI agents, get_profile reads the same: a request's, a job run's or a route's top functions by their own time, with their file and line and where their code is, then the hottest paths. Short Leash's chat can read it too.
Which runtimes can be profiled?
| Runtime | Profiler | Notes |
|---|---|---|
| PHP on a Mac | Excimer, in Short Leash's PHP | Short Leash's PHP builds for macOS. Not in PHP previews yet |
| PHP on Windows | Not yet | Excimer doesn't run on Windows yet, and the Monitor says so |
| Node | Node's own inspector | Approximate, and marked so: code that concurrent requests share can be counted under the wrong one |
| Python | Short Leash's agent | Samples the thread handling the request; threads your app starts itself aren't sampled |
| Ruby | stackprof | Add stackprof to your Gemfile. One profile at a time per process |
| Go, Deno, Bun and others through OpenTelemetry | None | The Monitor says so |
Site settings › Monitor lists the site's runtimes with the profiler each has, and what to do when one doesn't, such as adding stackprof.
Which profiles are kept?
A profile you asked for, one whose request or job failed, one slower than its route's P95 over the last day, and one in ten of the rest, so a route's merged profile includes ordinary requests. The others are dropped as the request ends.
A profile holds each function's name, file and line, and how often each stack of them was running. No arguments and no values are captured. Files inside the site are kept relative to it. Profiles are kept on your computer in the Monitor's history, go when the request or job they profiled goes, have their own 256 MB inside the Monitor's limit, oldest first, and are cleared with Clear history.